
A repaired Paygo – is it really still the way to go?
This is the third of a dozen articles on freight pricing strategies that were selected from over 100 identified freight pricing schemes that have come to the author’s attention over the last 15 years. It was intended that some of the more interesting strategies be examined first, with these to be followed by some of the more common traditional economic pricing schemes.
However, as the 23-year-old National Road Transport Commission/National Road Transport Commission (NRTC/NTC) Paygo (pay as you go) road pricing scheme is up for re-assessment it was thought this might be an appropriate time to look into this important Paygo model as to why it has lasted the distance, its efficiency and equity, as well as its major failings.
Recent comments from senior industry players have suggested that we should introduce a ‘road user pays’ replacement scheme. This is a great catch phrase, but the current Paygo system is absolutely and utterly an excellent road user pays scheme, but maybe it could be improved.
What is a ‘Pay As You Go’ (PAYGO) pricing scheme?
In the simplest of terms, the players, under a Paygo scheme, pay the costs that are outlaid for them to operate in their specific environment. That is, the scheme recovers the costs in providing the infrastructure or utilities that the users rely on to operate.
In this case, Paygo recovers the costs of the attributable truck use by trucks greater than 4.5 tonnes gross vehicle mass (GVM) for a range of incurred costs: a proportion of the common road costs like traffic lights, kerb and guttering, white lines, etc.; an allocation of the capital roads’ expenditure (new and rehabilitation) and maintenance costs across the three levels of government; and a degree of regulatory costs, which now even includes the costs of the National Heavy Vehicle Regulator.
Sounds easy, except maintenance and new capital investment can be very lumpy from year to year, and even truck use, in times of economic hardship, can actually go negative.
So, to overcome this year to year lumpiness, a degree of moving averaging has been employed in the cost recovery process.
This gets rid of the expenditure peaks and troughs, but does not keep all authorities happy, even though over the selected moving average period full cost recovery will be achieved. However, as Table 1 shows, all registration charges do not always get levied on a steady upward trend, and there have been some notable hiccups in recent times in the expected ‘smooth’ registration charges line matching a smoothed moving average, cost recovery function.
TABLE 1: Not so smoothed Registration Increases by configuration
|
Vehicle Configuration |
Adjustment Date |
% Increase actual |
|
B-Double 9 Axle |
Sept Qtr 2010 |
+25.5% |
|
B-Double 9 Axle |
Sept Qtr 2012 |
-8.30% |
|
Road Trains Double, Triple |
Sept Qtr 2012 |
+21.0% |
|
2 Axle Rigid Truck |
Sept Qtr 2012 |
+29.0% |
|
2 Axle Rigid Truck |
July 2016 |
+11.0% |
|
6 Axle Semi trailer |
Sept Qtr 2012 |
+11.3% |
|
3 Axle Truck, 3 Axle Dog |
July 2016 |
+32.0% |
|
3 Axle Truck, 4 Axle Dog |
July 2016 |
+30.7% |
|
Rigid Truck 8 x 4 |
July 2016 |
+11.4% |
Source: NTC Annual Registration notifications, various
So, a simple cost recovery procedure, when turned into a Paygo scheme for roads, may not be quite as simple as first thought, although it could still be an efficient and even ‘quasi’ equitable user pays cost recovery scheme.
The Historical Evolution and a bit of Politics
In 1995, the first NRTC Road Pricing Determination was enacted. However, what happened in 1994, one year earlier, was the release of a very important piece of analysis that was undertaken by the federal Department of Transport (Minister Bob Brown’s department at the time, the Brown one, not the Green one). However, the work was never published, but it certainly found an audience with the then Road Transport Federation, pre the emergence of the Australian Trucking Association, and the wider industry. Titled Taxes and Charges Paid by the Road Transport Industry, the in-camera analysis and distribution showed that the industry’s total tax contribution was some $32 billion, but the total roads outlay was only some $16 billion dollars. The road transport industry was definitely paying its way and was in fact almost the highest taxed sector in the economy. This work eventually
had an impact!
In 1995, this user pays system introduced a new charging framework that had advantages. There would be two parts in recovering the attributable costs to trucking. Obviously, a ‘fuel based’ charge recovered the industry’s attributable costs and a ‘standardised’ set of registration charges, as some smaller states were discounting rego heavily, would still go to the states.
This headed off a revenue turf war that could have been caused by a ‘fuel only’ charge, which is actually another efficient charging mechanism, but all that fuel revenue going to the federal treasury and sidelining the state treasuries could cause a war.
Where the 1994 Road Taxation Analysis Came into play
When the Goods and Services Tax (GST) package was introduced on July 1, 2000, there was a new element in this package besides the removal of sales taxes. It was the introduction of the on-road diesel rebate, which became known as the diesel fuel credit scheme, and is now known as the fuel tax credit scheme.
This introduction removed the ‘over-taxed’ fuel component in heavy vehicle charges, such that a road user charge and the truck registration fee less the (diesel) fuel tax credit covered Australia’s attributable trucking costs. Initially the scheme covered all of regional Australia, with some restrictions for vehicles under 20 tonnes GVM in capital cities and some large population conurbations. These restrictions were later removed.
In essence, the 1994 proof of significant over-taxation of the road transport industry had been vindicated with the activation of the diesel fuel credit scheme. However, there is now significant feeling that whatever taxation level is applied on each economic sector, if the market can bear it, general revenue benefits, irrespective of the equity or efficiency of the charging regime.
TABLE 2: Long Term Changes in the Road User Charge
|
Date |
RUC (cents/litre) |
|
2001/02 |
19.60 |
|
2004/05 |
20.00 |
|
2006/07 |
22.10 |
|
2009/10 |
21.70 |
|
2010/11 |
22.96 |
|
2012/13 |
25.00 |
|
2014/15 |
26.14 |
|
2016/17 |
25.90 |
|
2018/19 |
25.80 |
|
2019/20 |
25.80 |
|
Ave Growth p.a |
1.54% |
Source: NRTC, NTC Determinations and annual adjustments
Table 2 reflects the gradual increases and the more recent stabilisation of the road user charge. However, at this level, along with the rises in state registration fees, especially since the consumer price index cap on registration charges was lifted in July 2009, there has still been massive over-recovery of costs from the industry. It is estimated that for 2016/17, overcharging reached $250 million, and for 2017/18 this figure rose to $265 million, and yet some critics and tollway operators suggest that trucks do not pay their way!
Figure 1: Linehaul Registration changes vs CPI Since NRTC’s Determination 1
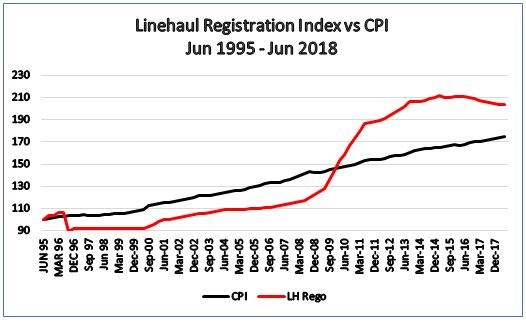
Source: Translog Databases 1984 – Current
The Inequity in the current Paygo system
As has often been stated by this author, there is a light year of difference between operations in the ‘hire and reward’ sector versus the ‘ancillary’ sector. It comes as a great surprise to many analysts, regulators and even politicians that the road freight industry is not totally dominated by the ‘hire and reward’ sector.
After all, the Road Safety Remuneration Tribunal was all about the hire and reward sector, which, as always, is referred to as ‘the industry’. Recently, a major report on driver health was reflective of ‘the industry’ and yet no ancillary operators were in the survey. Driver deaths, you would think, are dominated by the hire and reward ‘industry’, but in fact, they are evenly split between the hire and reward and ancillary sectors. So why then, from a pricing point of view, is this difference important?
Firstly, ancillary fleets, although many are small, dominate the Australian road fleet population.
Figure 2 Ancillary vs Hire and Reward Fleets 1996 – 2016
.JPG) Source: Industrial Logistics Institute from Translog databases
Source: Industrial Logistics Institute from Translog databases
As shown from Table 3 and Figures 2 and 3, the ancillary sector is larger than the hire and reward sector in fleets and in trucks. This is a rarely cited fact. The ancillary sector, as of 2016, had 56.5 per cent of the heavy vehicle fleet. BUT, ancillary does not hold the upper hand at all for kilometres travelled and gross tonne-kilometres performed on
the roads.
TABLE 3: Structure of Tracks >4.5 tonnes by Operation
|
Estimates Fleets and Trucks |
Ancillary |
Hire and Reward |
|
Number of fleets 1996 Est |
182040 |
30960 |
|
Number of fleets 2005 Est |
111807 |
49033 |
|
Number of fleets 2016 Est |
114826 |
42306 |
|
Number of trucks 1996 |
207200 |
108200 |
|
Number of Trucks 2005 |
205812 |
178503 |
|
Number of Trucks 2016 |
211464 |
162548 |
Table 4 presents an example of this kilometre travelled disparity for the standard semi-trailer, three-axle prime mover with a three-axle trailer. The average kilometres travelled per annum on Australia’s roads is around 71,500km per annum. Ancillary semis, based on several surveys, perform about 15,500 km per annum, often a bit less for the agricultural sector.
This implies that to attain the national average kilometres of 71,510km per annum, for a semi-trailer, the hire and reward sector performs, on average, about 103,500km per annum. This is over six times the kilometres performed by the ancillary operator and yet their registration charges under the current Paygo methodology are the same!
This is because the current charges are based on average kilometre by vehicle configuration, which gives a massive cross subsidy to the hire and reward sector. Perhaps Paygo is not so equitable after all.
Figure 3 Ancillary vs Hire and Reward Truck Numbers 1996 – 2016
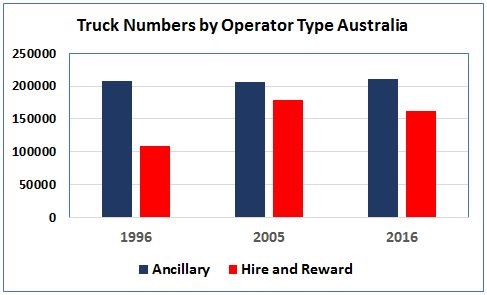 Source: Industrial Logistics Institute from Translog databases
TABLE 4: Australia’s 6 Axle Semi: Hire and Reward vs Ancillary kms pa
|
Operation |
Number Semis (2015) |
Ave kms p.a |
|
Hire & Reward |
30,125 |
103,556 |
|
Ancillary |
17,236 |
15,500 |
|
Total |
47,361 |
71,510 |
Source Derived from NTC 2015, SMVU 216 data cubes, Translog Surveys
How is this huge inequity fixed? Well, generating the Australian Bureau of Statistics special data cube for ‘own business’ (ancillary) and hire and reward kilometres travelled by vehicle configuration would be a great start.
This should be possible, but has been resisted. If this kilometre segmentation data were available a new dimension, perhaps radical, but a lot simpler and less costly than fitting all trucks with a GPS, could be achieved. What would this radical idea be?
As a thought, the new road charging body could develop two road user charges and two diesel fuel rebate rates, one for the hire and reward sector and one for the ancillary sector. How equitable is this? We would then save on fitting GPS systems to 211,000 ancillary trucks and they would save at least $1 a day in telemetry charges. That would be a saving of $77 million per annum!
For those large trucking and logistics associations that have called for a more equitable road charging scheme, be very careful, you may get what you wished for!
Dr Kim Hassall is a noted transport academic and director of Industrial Logistics Institute.
12 FREIGHT PRICING STRATEGIES
Part 1: Network link (density) pricing